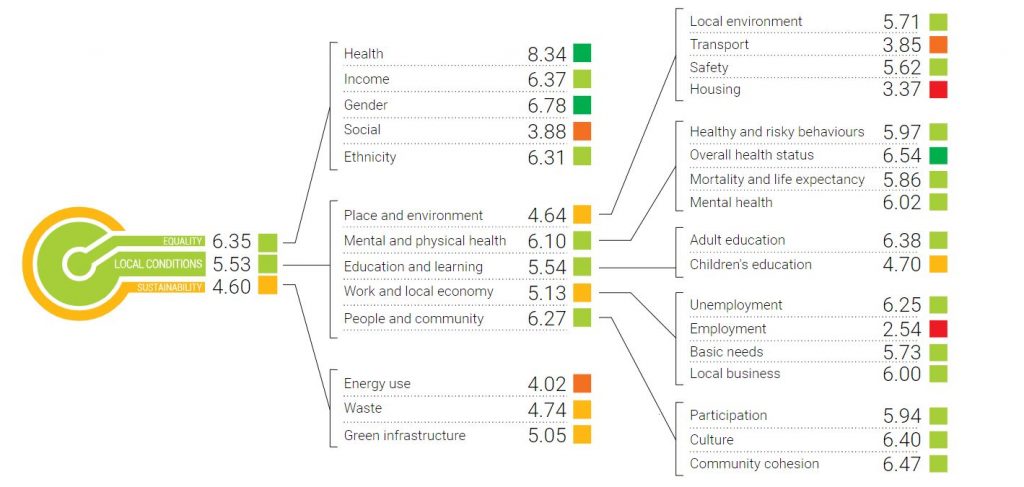
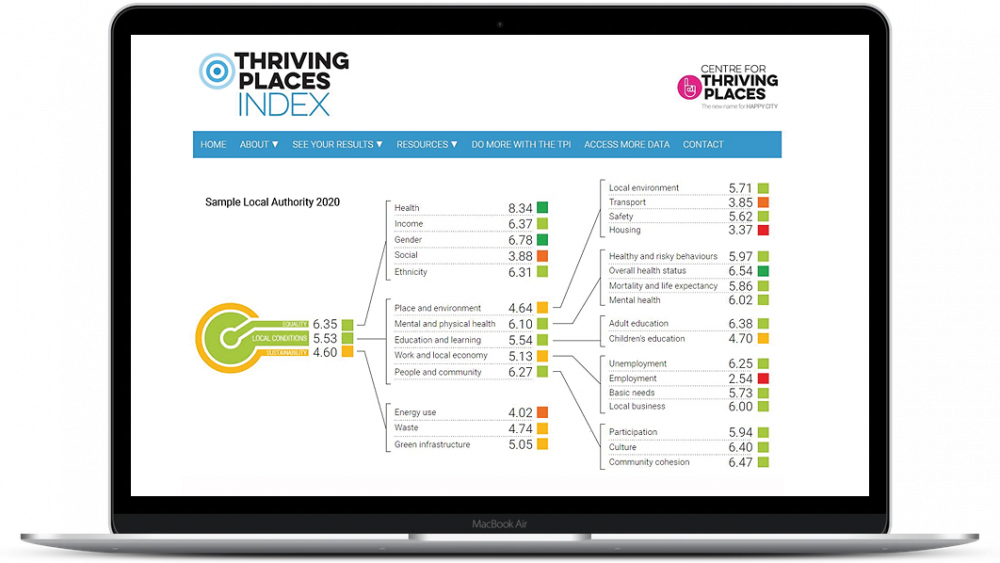
Today, we’ve launched the 2020 data set for the Thriving Places Index, now in its fourth year. The 2020 results for 363 Local Authorities in England and Wales are now live at www.thrivingplacesindex.org – head there to see your Local Authority’s scores across Local Conditions, Sustainability and Equality.
We understand that this is a deeply challenging time. But an economic system focused purely on growth is also one that overlooks resilience as well as wellbeing. The Thriving Places Index is a holistic way to understand decision making through the lens of wellbeing, sustainability and equality. In times of crisis, understanding places in the round (and how best to support wellbeing) remains a key priority.
Our current economic system often fails to recognise and value the things we can see we need more than ever including equality of health and wellbeing, fairly distributed access to services, social connection, secure jobs, community participation, local trust and security, and a clean environment. The Thriving Places Index assesses these vital social goods and helps decision makers put them front and centre of their policy and action now and for the long term.
We are proud to be playing our part to help shift the dial towards what matters for current and future generations to thrive, and look forward to working with pioneering leaders across the UK to build a resilient and healthy ‘wellbeing economy’, place by place in the many months and years ahead.
We still believe it’s both urgent and possible to shift society’s compass from growth-at-any-cost to a new model of prosperity centred on wellbeing. But to get there we need new ways of thinking and new measures to build a credible base on which to deliver change. The TPI provides just that. It’s systems-change made practical.
Thriving Places Index 2020
Each year we’ve released the TPI we’ve strengthened and improved it – this year we have designed new, more intuitive scorecards which give a quick visual overview of conditions in each Local Authority. We’ve also added new indicators to both the sustainability and equality domains, to highlight the key importance of delivering wellbeing both equitably and sustainably.

Key insights from this year include:
- The top 10 scoring Local Authorities (LAs) for the People and Community domain features LAs from all regions of England; there is less of a North-South divide than in previous releases of the Thriving Places Index.
- The South West is the only region in which all Local Authorities have average to high Local Conditions scores. Cornwall has the lowest NO2 concentration in the air of all Local Authorities.
- It’s no surprise that houses are least affordable in the South of England. The best housing affordability ratio is in Knowsley in the North West. The top five LAs for housing affordability cover all of the regions in the North and the Midlands.
- The highest percentage of people going to work through active travel is in London; Westminster has 47.5% walking and Southwark has 16.52% cycling
By looking at a much broader picture of what supports the wellbeing of communities, the TPI’s asset-based approach shows what’s already going well and highlights that different areas experience different challenges. It supports decision makers across sectors to assess and prioritise policy, based on the impact it has on the wellbeing and sustainability of people and communities.
The TPI gives a clear picture and a practical dashboard to help us understand how to meet a broad range of current and future needs in a local area. This clarity is an essential first step towards creating a better, fairer and healthier economic system that works for the people who contribute to it – that is, all of us.
See your local authority’s scores at www.thrivingplacesindex.org now or read more about the framework and how to use it.


Comments are closed.