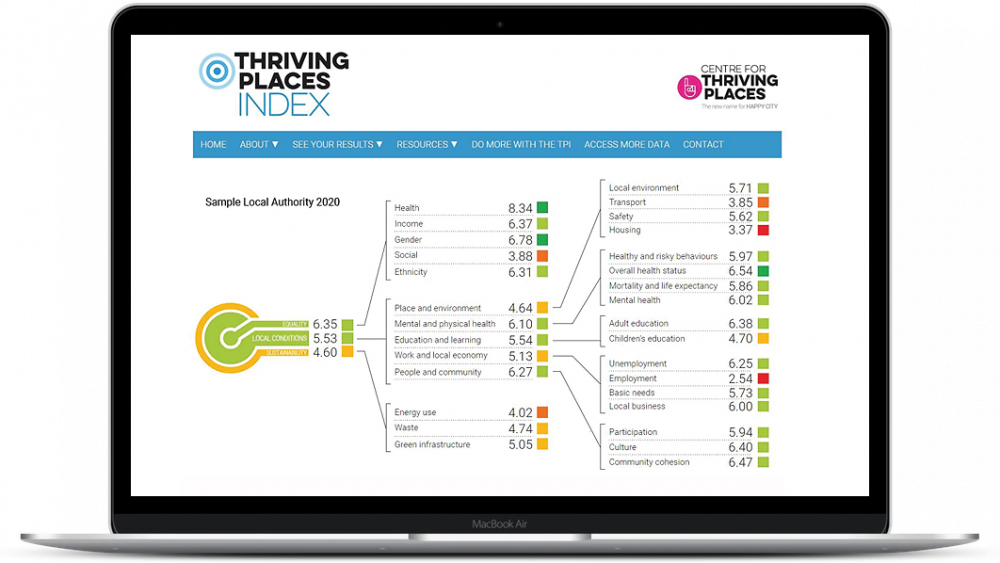
On March 18 2020 we released the fourth annual Thriving Places Index. The Thriving Places Index identifies the local conditions for wellbeing and measures whether those conditions are being delivered fairly and sustainably.
It consists of a broad set of indicators selected from datasets produced by established data agencies such as the Office for National Statistics (ONS), Public Health England (PHE) and the Index of Multiple Deprivation (IMD). We select indicators that measure or provide a proxy for, the key factors known to have an influence on wellbeing. The TPI includes data for all upper and second tier Local Authorities in England and Wales.
All 2020 data and Local Authority scorecards are available at www.thrivingplacesindex.org
Key insights from 2020 include:
- The top 10 scoring Local Authorities (LAs) for the People and Community domain features LAs from all regions of England; there is less of a North-South divide than in previous releases of the Thriving Places Index.
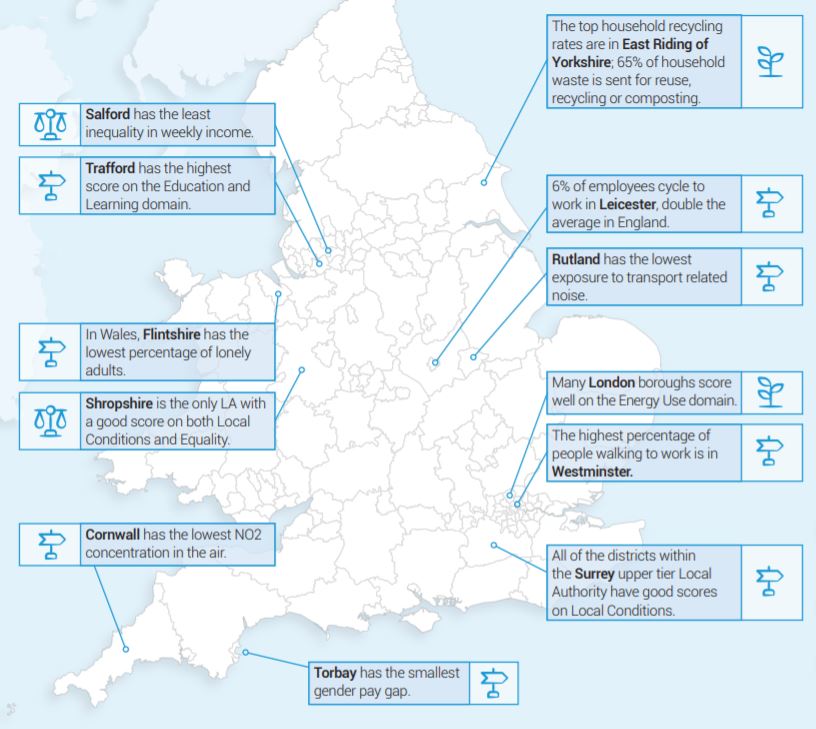
- The South West is the only region in which all Local Authorities have average to high Local Conditions scores. Cornwall has the lowest NO2 concentration in the air of all Local Authorities.
- It’s no surprise that houses are least affordable in the South of England. The best housing affordability ratio is in Knowsley in the North West. The top five LAs for housing affordability cover all of the regions in the North and the Midlands.
- The highest percentage of people going to work through active travel is in London; Westminster has 47.5% walking and Southwark has 16.52% cycling
By looking at a much broader picture of what supports the wellbeing of communities, the TPI’s asset-based approach shows what’s already going well and highlights that different areas experience different challenges. It supports decision makers across sectors to assess and prioritise policy, based on the impact it has on the wellbeing and sustainability of people and communities.


Comments are closed.