Thriving Places Dashboard

The 2024 Thriving Places Index (TPI) provides an up-to-date picture of how well different areas are doing in creating the conditions for everyone to thrive.

It brings together the very best existing data and evidence to help you understand and map the pathways to developing a thriving place where you are.

Does your place support people and planet to thrive?

The Thriving Places Index (TPI) dashboard lets you see how your local authority compares to the rest of England on key factors that support the wellbeing of current and future generations.

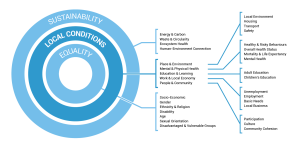
It is based on the broader Thriving Places Framework* which has three headline domains: Local Conditions, Equality and Sustainability.

There is a layered approach to allow you to look at specific aspects of each headline area. 

For example, Local Conditions is made up of five domains, including Place & Environment and Work & Local Economy.

Sustainability is made up of four domains including Energy & Carbon and Ecosystem Health.

The Local Conditions domains are further broken down into subdomains for a more detailed look at performance in specific areas, such as Housing, Transport and Safety.

The dashboard above allows you to explore the data and compare different places and domains to understand the strengths and challenges of each area.

You can also explore the data via our Map view here.

Or find out more about the Thriving Places Framework, Index and approach here.

*Please note that some subdomains of the broader Thriving Places Framework do not appear in the Index, as there is not sufficiently reliable data consistently available for them across all areas of England.  They are in the framework to show their significance to wellbeing outcomes and for use in our in-depth work with places

What do the scores and colours mean?

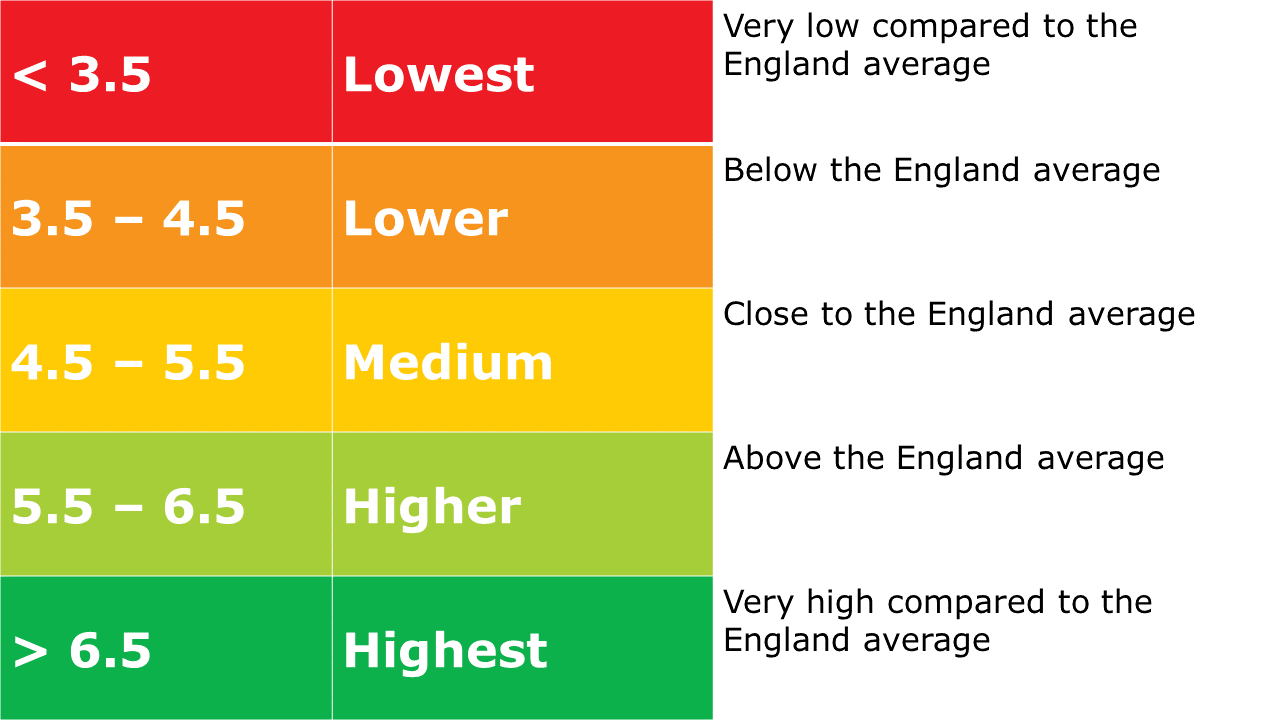
The Index scores are between 0 and 10. A high score indicates better performance relative to other places.

Colour coding is applied to make it easy to see how your place compares to other Local Authorities.

Index score key. < 3.5 = very low compared to the England average. 3.5-4.5 = below the England average. 4.5-5.5 = close to the England average. 5.5-6.5 = above the England average. > 6.5 = very high compared to the England average

Key to explain TPI scores

Using the dashboard

To see your local authority scores: Select the name of the local authority using the drop-down in the top corner to see the headline scores. Click on the title (Local Conditions, Equality, Sustainability) to explore the domain and subdomain scores in the different areas.

Compare local authorities: Click on the ‘Compare TPI Scores for LAs’ button in the bottom corner. Use the drop-down to select up to three local authorities. Click on the title of the headlines or domains to explore the scores in each area.

Links & Downloads

Understanding the Thriving Places Index Dashboard

Frequently asked questions

Where does the data behind the TPI come from?

The TPI uses data from trusted sources like the Office for National Statistics, Fingertips Public Health Data, the Understanding Society Survey, and the Index of Multiple Deprivation.

For each area of the Index, like Housing or Energy & Carbon, we identify the best available indicators to understand how different places are doing. Most areas of the Index combine several indicators, however a few are based on a single indicator. 

An indicator is a specific measure used to represent and track social, economic or environmental conditions over time. For example, we use indicators relating to physical activity and eating ‘5-a-day’ to understand and track healthy behaviours.

We use data in the TPI that is available at the local authority level or can be calculated at that level. We also focus on indicators that are current, can be updated regularly and are available to the public. A number of the indicators have been specifically developed by CTP for the TPI (see Methodology for details).

Here is a list of the 2024 TPI Indicators. If you are interested in the complete dataset, please contact us at tpi@centreforthrivingplaces.org.

How are the Index scores calculated?

The TPI uses diverse types of data (like health data, environmental data, and survey results) that measure a range of things on different scales. To allow us to combine these into the Index, we follow these steps:

  1. First, we calculate a ‘z-score’ for each indicator, which is a statistical measure that indicates how a place’s performance compares to other local authorities. These scores allow us to compare measures even if they are very different (like the percentage of the population who are physically active versus the amount of renewable electricity generated in that area).
  2. For indicators that track negative conditions (like the percentage of people with low wages), we reverse the scores so that a higher z-score always reflects conditions that are better for wellbeing.
  3. Finally, we average the z-scores to create the Index scores for each part of the framework. The headline TPI scores (Local Conditions, Sustainability, Equality) are then based on the average of the relevant Index scores.

Full details of the calculations are on page 8 of the methodology.


Can you compare changes in TPI scores over time?

The 2024 TPI uses the same general methodology as previous editions from 2019 onwards. However, significant updates have been made to the Sustainability and Equality areas, which means these scores should not be compared to past results.

In other parts of the Index, trends should also be interpreted carefully due to changes in some of the indicators. These include replacing or adding new indicators, and updates to the methodologies used for source data. The indicator list contains details of any changes. You can find further information in the methodology.

If you want to explore trends for your area, please get in touch at tpi@centreforthivingplaces.org, and we can assist you in finding the best approach.

Are there any gaps in the TPI?

The TPI is based on the Thriving Places Framework, which maps out the conditions a place needs to thrive. We aim to cover as many of these as possible within the TPI. However, there are some important areas where the right type of data isn’t currently available at the local authority level.

Finding data for the Equality and Sustainability areas is particularly challenging. For example, we’d like to include data on biodiversity and habitats, water quality, gender differences in unpaid work and factors affecting marginalised and vulnerable communities.

We will continue to seek out and advocate for local data in these areas and will add it to the TPI whenever possible.

Is it possible to see TPI scores for areas within a Local Authority?

The TPI uses existing data from public bodies and research organisations. Most of this data isn’t available for areas smaller than a local authority (e.g. Ward, MSOA or LSOA). Because of this, we can only produce the TPI at the upper tier and district local authority level.

However, CTP collaborates with various organisations to apply and adapt the Thriving Places Framework, which the Index is based on, to work at a more local level. This includes building data on specific areas within a local authority. If you are interested in discussing this further, please get in touch at tpi@centreforthivingplaces.org.


Data for towns

CTP, in collaboration with Carnegie Trust UK and Power to Change, created a Building a Wellbeing Economy Roadmap for Towns and  Wellbeing Economy Data Guide for Towns.

Is there a TPI for Wales, Scotland or Northern Ireland?

Historically, CTP has published the TPI for England and Wales only. In 2024, the TPI was updated for England, and we aim to update the Wales TPI in 2025. There are some differences in the indicators used for England and Wales because the official statistics and available data are not always the same

The Thriving Places Framework is valuable and adaptable (for example, by tailoring to available data and local structures) across different regions, including Scotland, Northern Ireland, and beyond the UK. If you’re interested in applying the Thriving Places model in other areas, please contact us at tpi@centreforthrivingplaces.org.
What does it mean when it says ‘Not Available’ in the dashboard?

‘Not Available’ means there isn’t sufficient data to provide an Index score for that part of the TPI in that local authority. There are two main reasons for this:

First, some indicators aren’t available for districts (lower tier local authorities). If a part of the Index is based on these indicators, the score will show as ‘Not Available’ for all districts.

There are also several indicators where specific places have missing data. This is usually because the sample size is too low or official data isn’t publicly available. This issue is more common in districts , which are smaller than upper tier local authorities. Where possible, we try to avoid using indicators with missing data.

For details of indicators which are not available for districts, see the Indicator List. For details of indicators that have missing data, see Section 2.6 of the Methodology.

Cancel