Last week, the Office for National Statistics (ONS) released their annual personal wellbeing data at local level bulletin. This is a data set and analysis of self-reported wellbeing – people’s own assessment of how they feel about their lives. For the second year running, the ONS have included data from the Thriving Places Index to shed light on local authorities with particularly low or high levels of wellbeing.
Every year, the ONS publishes averages for each local authority in the UK. Typically referred to as the ONS4, the questions cover happiness, life satisfaction, how worthwhile the things you do in life are, and anxiety. This authoritative data set gives an excellent idea of how people in the country are feeling, and there are clear reasons for positivity – with a lower proportion of people reporting low and medium life satisfaction compared to last year.
However, whilst the ONS shows how people are feeling, it is harder to explain why well-being ratings are different across different local authority areas in the UK using that data alone. In contrast to collecting self-reported wellbeing data, the Thriving Places Index (TPI) collates data that can be used to show the conditions, or drivers for wellbeing.
It consists of a broad set of indicators from datasets produced by established national data agencies such as the ONS, Public Health England (PHE) and the Index of Multiple Deprivation (IMD). These indicators are arranged into headline elements – local conditions, sustainability and equality. These headline elements support a broad dialogue about whether an area is creating the conditions for people to thrive, within environmental limits and in a socially just way.
Like two sides of the same coin, self-reported wellbeing and the conditions for wellbeing together provide a fuller picture of how people are feeling, with some indication of why they might be feeling that way. Pairing the TPI with the ONS4 results is powerful as it means we can try to explain why places score the way they do on the ONS4 and see what areas might be best to focus on for improving overall wellbeing.
The ONS has used Lambeth and Wolverhampton as an examples of local authorities with consistently poor personal wellbeing and Chichester and North Devon as local authorities with consistently high personal wellbeing over an eight year period (read the case studies here). But as well as examining these places individually, we can also use the TPI to compare how well these places are creating the conditions to thrive.
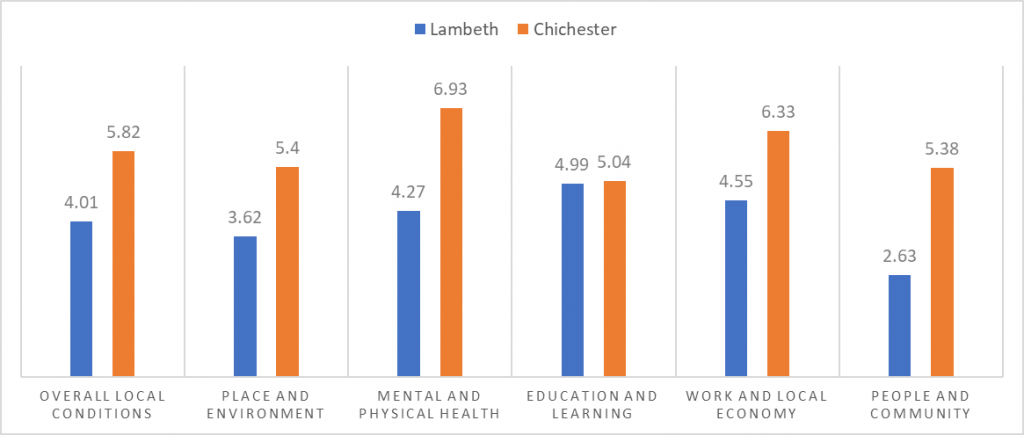
The graph below shows how Chichester and Lambeth perform on Local Conditions and the five domains within Local Conditions (place and environment, mental and physical health, education and learning, work and local economy people and community). Read more about the framework for the TPI here.

Lambeth and Chichester differ the most on the People and Community and the Mental and Physical Health domains. Their most similar scores are on the Education and Learning domain. This shows that what Lambeth is performing most poorly on is People and Community domain, so this could be an area for the local authority to focus on improving.
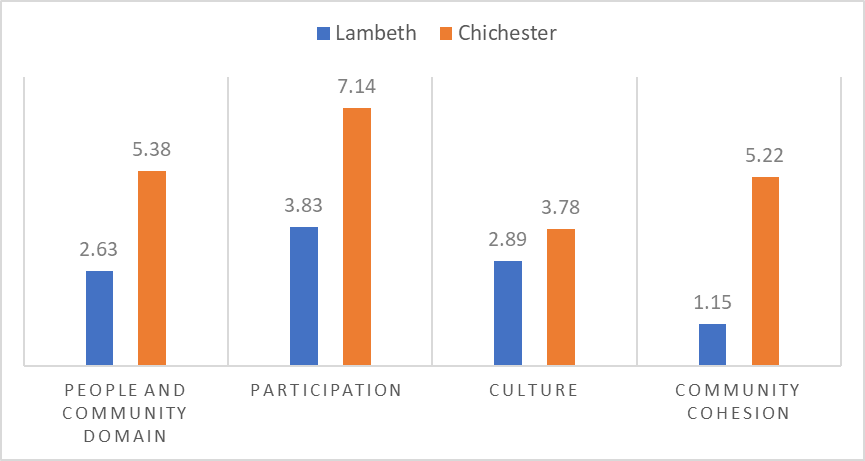
When we take a closer look at this domain, although Lambeth performs more poorly than Chichester on all sub-domains, the biggest discrepancy is in Community Cohesion, measured using the Social Fragmentation Index. This suggests that Lambeth can improve their people and community score, and indeed wellbeing overall, by improving community cohesion.

Despite the fact that Lambeth has a consistently low ONS4 score, and scores poorly on some of the local conditions indicators, it scores better on the Equality headline element than Chichester does – so even though Chichester might have more of the drivers of wellbeing in place those benefits aren’t necessarily distributed fairly throughout society.
This highlights that what the TPI shows us is that different local authorities experience different challenges but also do well in different areas. The Thriving Places Index highlights what’s already going well in a local authority as well as possible areas for action. Lambeth for example, scores highly on social mobility and income equality across genders. Neither the ONS4 scores or the TPI show a simple league table with wellbeing winners and losers.
It’s hard to understand how you could begin to improve wellbeing just by looking at self-reported wellbeing, and that’s why we think there’s such powerful potential in a dataset that is based on the drivers of wellbeing. But equally, without looking at the ONS4 scores it’s difficult to know if changes are having the positive impact you hope for. This is why for the 2020 release of the Thriving Places Index we’ll be including ONS4 scores alongside the TPI scorecards and summary scores.
The Thriving Places Index framework offers a new way to think about and change policy emphasis, in particular if you are seeking to move to a more interconnected model of local prosperity with sustainability and fairness at its core. If you’re interested in working with the Thriving Places Index in your local authority area then please get in touch with wwren@centreforthrivingplaces.org


Comments are closed.